Short answer: UGC ROI = (revenue you can credit to the content − everything the content cost you) ÷ that cost. The formula is easy; the honest part is that a chunk of UGC's value is upper-funnel and never click-attributes cleanly. So you measure it in two layers — hard attributed sales plus a defensible estimate of assisted lift — and read leading indicators (views over time, saves, watch-through) to make decisions before the sales data catches up.
Ask ten D2C brands for their UGC ROI and you'll get ten confident numbers calculated ten different ways — most of them wrong, and a few of them fantasy. The arithmetic is grade-school. The hard part is deciding what counts as "return," what counts as "cost," and how much credit a TikTok that someone watched three weeks before buying actually deserves.
This is the how-to companion to which UGC metrics matter — that post covers the KPIs to watch; this one is the ROI math, the attribution logic, and the cost accounting that sit underneath them. If you already know your metrics, here's how to turn them into a number you can defend.
What UGC ROI actually means (and why most brands get the number wrong)
Start with the textbook UGC ROI formula, because everything else is a variation on it:
ROI = (Gain from the content − Cost of the content) ÷ Cost of the content × 100
A worked example (numbers illustrative):
- You run six creators for a month.
- Cost: software ~$200 + creator payouts ~$1,800 + paid amplification of the best clips ~$2,000 = $4,000.
- Gain: revenue you can credit to that content = $12,000.
- ROI = (12,000 − 4,000) ÷ 4,000 × 100 = 200% — the same program expressed as a 3:1 ROAS.
Two things to notice. First, ROI (200%) and ROAS (3:1) describe the same result with different arithmetic — ROI nets out cost, ROAS doesn't — so never quote one and call it the other. Second, and this is the whole article: that $12,000 "gain" is the single most contested number in the calculation. Think of it as two layers — the sales you can hard-attribute, plus a defensible estimate of the assisted value you can't. The rest of this post is about earning the right to write both down.
The portfolio trap. Most brands compute ROI one video at a time, then panic when four of five clips lose money. But UGC is a portfolio bet, like paid creative — a minority of assets carry the return. Judge the program over a quarter, not each video on its own day. A single-video ROI is useful for deciding what to cut; it's useless for deciding whether UGC works.
The loose-categorization trap. The other way brands fool themselves is by dumping everything into one average: organic reposts, whitelisted paid ads, email-sourced reviews, and platform-submitted clips all blended into a single "UGC ROI." Those have wildly different costs and conversion paths. Splitting them — even into three rough buckets — turns a meaningless average into three numbers you can act on.
Start with the cost side — it's bigger than you think
ROI is a fraction, and brands obsess over the numerator (revenue) while low-balling the denominator (cost). Undercount cost and your ROI looks great right up until the P&L disagrees. Here's the full checklist:
| Cost bucket | What's in it | Easy to miss? |
|---|---|---|
| Creator payouts | Base fees, per-post rates, CPM/performance bonuses, product gifting (at COGS), usage/whitelisting fees | Gifting COGS and usage fees almost always get left out |
| Paid amplification | Ad spend behind the UGC you boost or whitelist | No — but usually tracked in a silo separate from creator cost |
| Software & tooling | Analytics, tracking, campaign management, editing | Small monthly line, but real |
| Management time | Sourcing, briefing, reviewing, reshoots, approvals, payouts — your team's hours × loaded cost | The biggest hidden cost, and the one nobody logs |
| Rework & misfires | Creators who ghosted, content you paid for and never used | Silent — it just disappears |
The line that wrecks calculations is time. If a coordinator spends ten hours a week wrangling creators, that labour is part of your UGC cost whether or not it lands on an invoice. A "3:1 ROAS" program that quietly eats twenty hours of senior time a month may be underwater once you price the hours in. (For how the payout side alone adds up, see UGC creator payouts.)
The honest part: most of UGC's value won't click-attribute
Here's what the ROI-calculator blog posts skip: a large share of UGC's value never shows up in a last-click report. Someone sees a creator's TikTok on Monday, doesn't click, thinks about you for two weeks, then Googles your brand name and buys direct on a Thursday. Your analytics credits "organic search" or "direct." The TikTok that actually did the work gets zero.
That's not a tracking bug you can fix — it's the nature of upper-funnel, discovery-led content. UGC's job is often to create demand, not capture it, and demand creation is genuinely hard to pin to a click. Pretending there's one clean ROAS number for it is how brands end up killing content that was quietly feeding their branded search.
So measure UGC at two speeds. Leading indicators move first and tell you what's working weeks before the sales data confirms it. Lagging indicators are the money, but they arrive late and messy.
| Leading indicators (early, directional) | Lagging indicators (late, financial) |
|---|---|
| Views over time (is a clip still pulling weeks later?) | Attributed sales / revenue |
| Watch-through and retention | Cost per acquisition (CPA) |
| Saves, shares, sends | Conversion rate on UGC-driven traffic |
| Comment sentiment and "where do I buy this" intent | New-customer rate vs. repeat |
| Branded-search and direct-traffic lift | Contribution to blended MER (below) |
The mistake is waiting for the lagging column before you act. A clip with climbing views, high saves, and "need this" comments is working now — you can scale it before a single sale is attributed. Leading indicators are how you make fast decisions; lagging indicators are how you prove you were right.
Attribution models: last-click, multi-touch, and portfolio (MER)
Once you accept that no attribution model is perfect, you can pick one deliberately instead of defaulting to whatever your dashboard shows. Three broad approaches:
| Model | How it credits UGC | Where it fails |
|---|---|---|
| Last-click | 100% of credit to the final click before purchase | Systematically undercounts UGC — the discovery view that started the journey gets nothing |
| Multi-touch | Splits credit across touchpoints (first click, assists, last click) | Better, but only counts clicked touchpoints; a scroll-past TikTok that drove branded search stays invisible |
| Portfolio / MER | Ignores per-touch credit; measures total revenue ÷ total marketing spend | Can't isolate one creator or clip — it's a program-level lens, not a per-video one |
Last-click is the default and the worst for UGC specifically: it lives at the top of the funnel where last-click has nothing to credit. Judge UGC on it alone and you'll conclude it doesn't work — then cut the thing feeding your "direct" traffic. Multi-touch is a real improvement worth setting up, but it can only credit touchpoints that produced a click, so the most common UGC behaviour — watch, don't click, buy later — stays invisible to it.
MER (Marketing Efficiency Ratio) — total revenue ÷ total marketing spend — is the pragmatic answer many D2C brands land on. Instead of asking "which clip drove this sale," you watch blended MER as you scale UGC up or down. Push UGC spend up for six weeks; if blended MER holds or improves while UGC is the thing you changed, UGC is contributing even where you can't trace individual clicks. It won't tell you which creator won — pair it with per-creator leading indicators for that — but it catches the upper-funnel lift the click-based models miss.
Practical ways to attribute UGC (and where each one lies)
You don't need a perfect model — you need two or three overlapping signals that each cover the others' blind spots.
1. UTM parameters and unique codes. Give every creator (and ideally every hero clip) a unique discount code, link, or UTM. When a creator's code gets redeemed, that's about as clean a signal as UGC offers, and the codes double as the creator's performance-bonus basis. The limit: codes and links only catch people who click or type them. Most upper-funnel viewers who buy later never touch the code — so treat code revenue as a floor, not the total.
2. Post-purchase surveys. The "How did you hear about us?" question at checkout catches exactly what pixels miss — the customer who saw a TikTok, didn't click, and bought two weeks later. Run it continuously and it becomes a second, human attribution layer. The limit: it's self-reported and fuzzy — people misremember, over-credit the last thing they saw, and skip the question. Directionally excellent, decimal-precise never.
3. Holdout and geo tests. The closest thing to truth: turn UGC off for a matched region or audience while leaving it on elsewhere, and measure the gap. A geo holdout across two comparable markets isolates incremental lift better than any pixel, because it measures what happens without the content. The limit: holdouts need enough volume to be statistically meaningful and real discipline to run cleanly — you're deliberately giving up sales in the holdout to buy a trustworthy read. Worth it periodically, not weekly.
Stack all three and the picture converges: codes give you a hard floor, surveys catch the assisted middle, and a periodic holdout tells you how much lift you're missing entirely.
Benchmarks: what "good" UGC ROI looks like
Every brand wants a target to grade against. The most widely cited rule of thumb is a 3:1 ROAS (roughly 200% ROI) as a "healthy" baseline for D2C marketing — but treat that as a starting reference, not a law. (Numbers here are illustrative; your real UGC ROAS benchmark is your own margin and payback window.)
What "good" actually depends on:
- Margin. A 70%-margin skincare brand can thrive at a lower ROAS than a 25%-margin apparel brand. The same 3:1 is comfortable for one and underwater for the other.
- Category and price point. High-consideration or high-AOV products have longer, messier paths where last-click especially understates UGC — so a "low" measured ROAS there can hide real upper-funnel value.
- New vs. returning. UGC that acquires new customers is worth more than the raw ROAS suggests once you price in lifetime value.
The cleaner way to benchmark isn't against an internet number at all — it's against your own other creative. A/B test the same offer with UGC versus polished studio/brand-made ads and compare CPA, conversion rate, and thumb-stop. That isolates UGC's impact on your product, your audience, your margins — the only benchmark that pays your bills. (UGC frequently wins that test on cost-efficiency, which is the pattern behind UGC vs influencer ads data.)
Turn the numbers into decisions
Measurement you don't act on is a hobby. The point of all this is a short list of decisions you make every month:
- Keep / cut creators. Rank creators by cost (what you paid) against performance (code revenue + survey mentions + sustained views). Strong leading indicators and improving code revenue get re-hired and scaled; persistent zero-signal creators get dropped — even if their content "looked" good.
- Double down on formats, not just people. Tag content by format — testimonial, unboxing, tutorial, day-in-the-life — and roll up ROI by format, not only by creator. Often the winning variable is the format, and you can brief it across your whole roster.
- Reallocate amplification. Put paid spend behind the specific clips already earning it organically (climbing views, high saves), not evenly across everything.
- Fix the cost side too. Sometimes the ROI fix isn't more revenue — it's tying more of your creator spend to performance, so payouts scale with results instead of ahead of them.
How Gromore ties cost and performance together
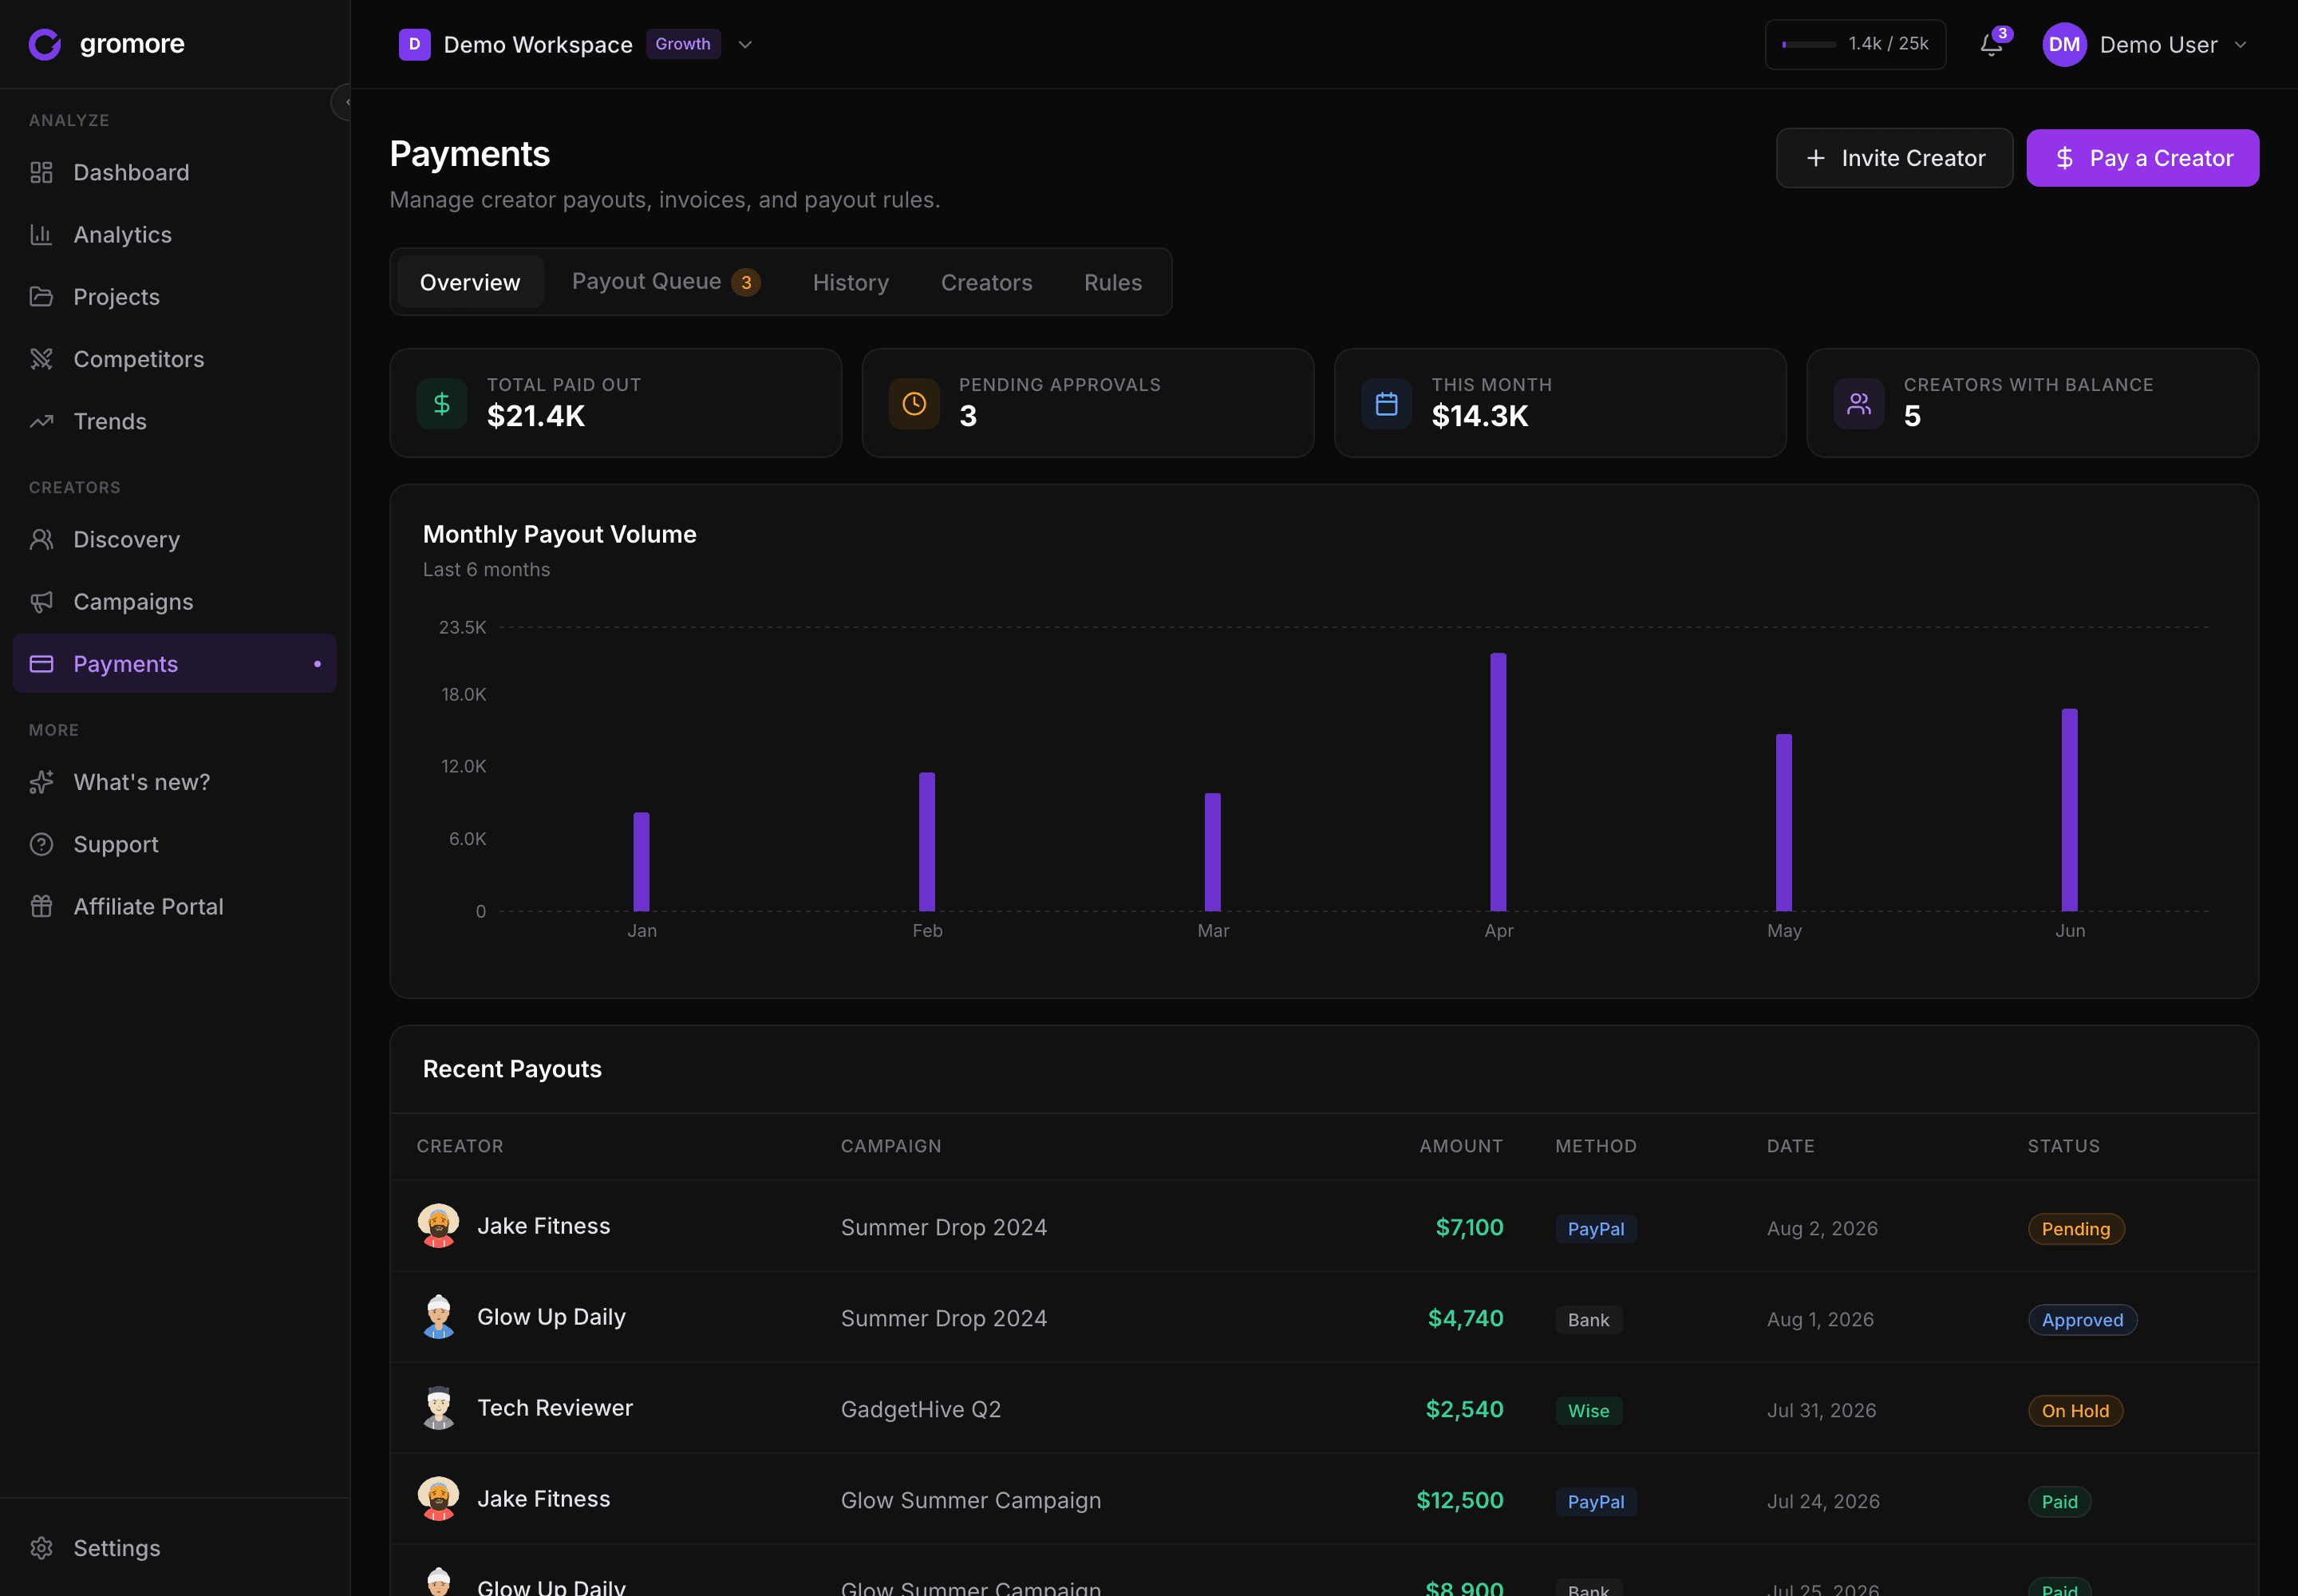
Most of the pain in UGC ROI isn't the formula — it's that the numbers live in five places. Payouts in a spreadsheet, views in the TikTok and Instagram dashboards, codes in your store, briefs in email. Rebuilding one ROI number means stitching all of it by hand, every month.
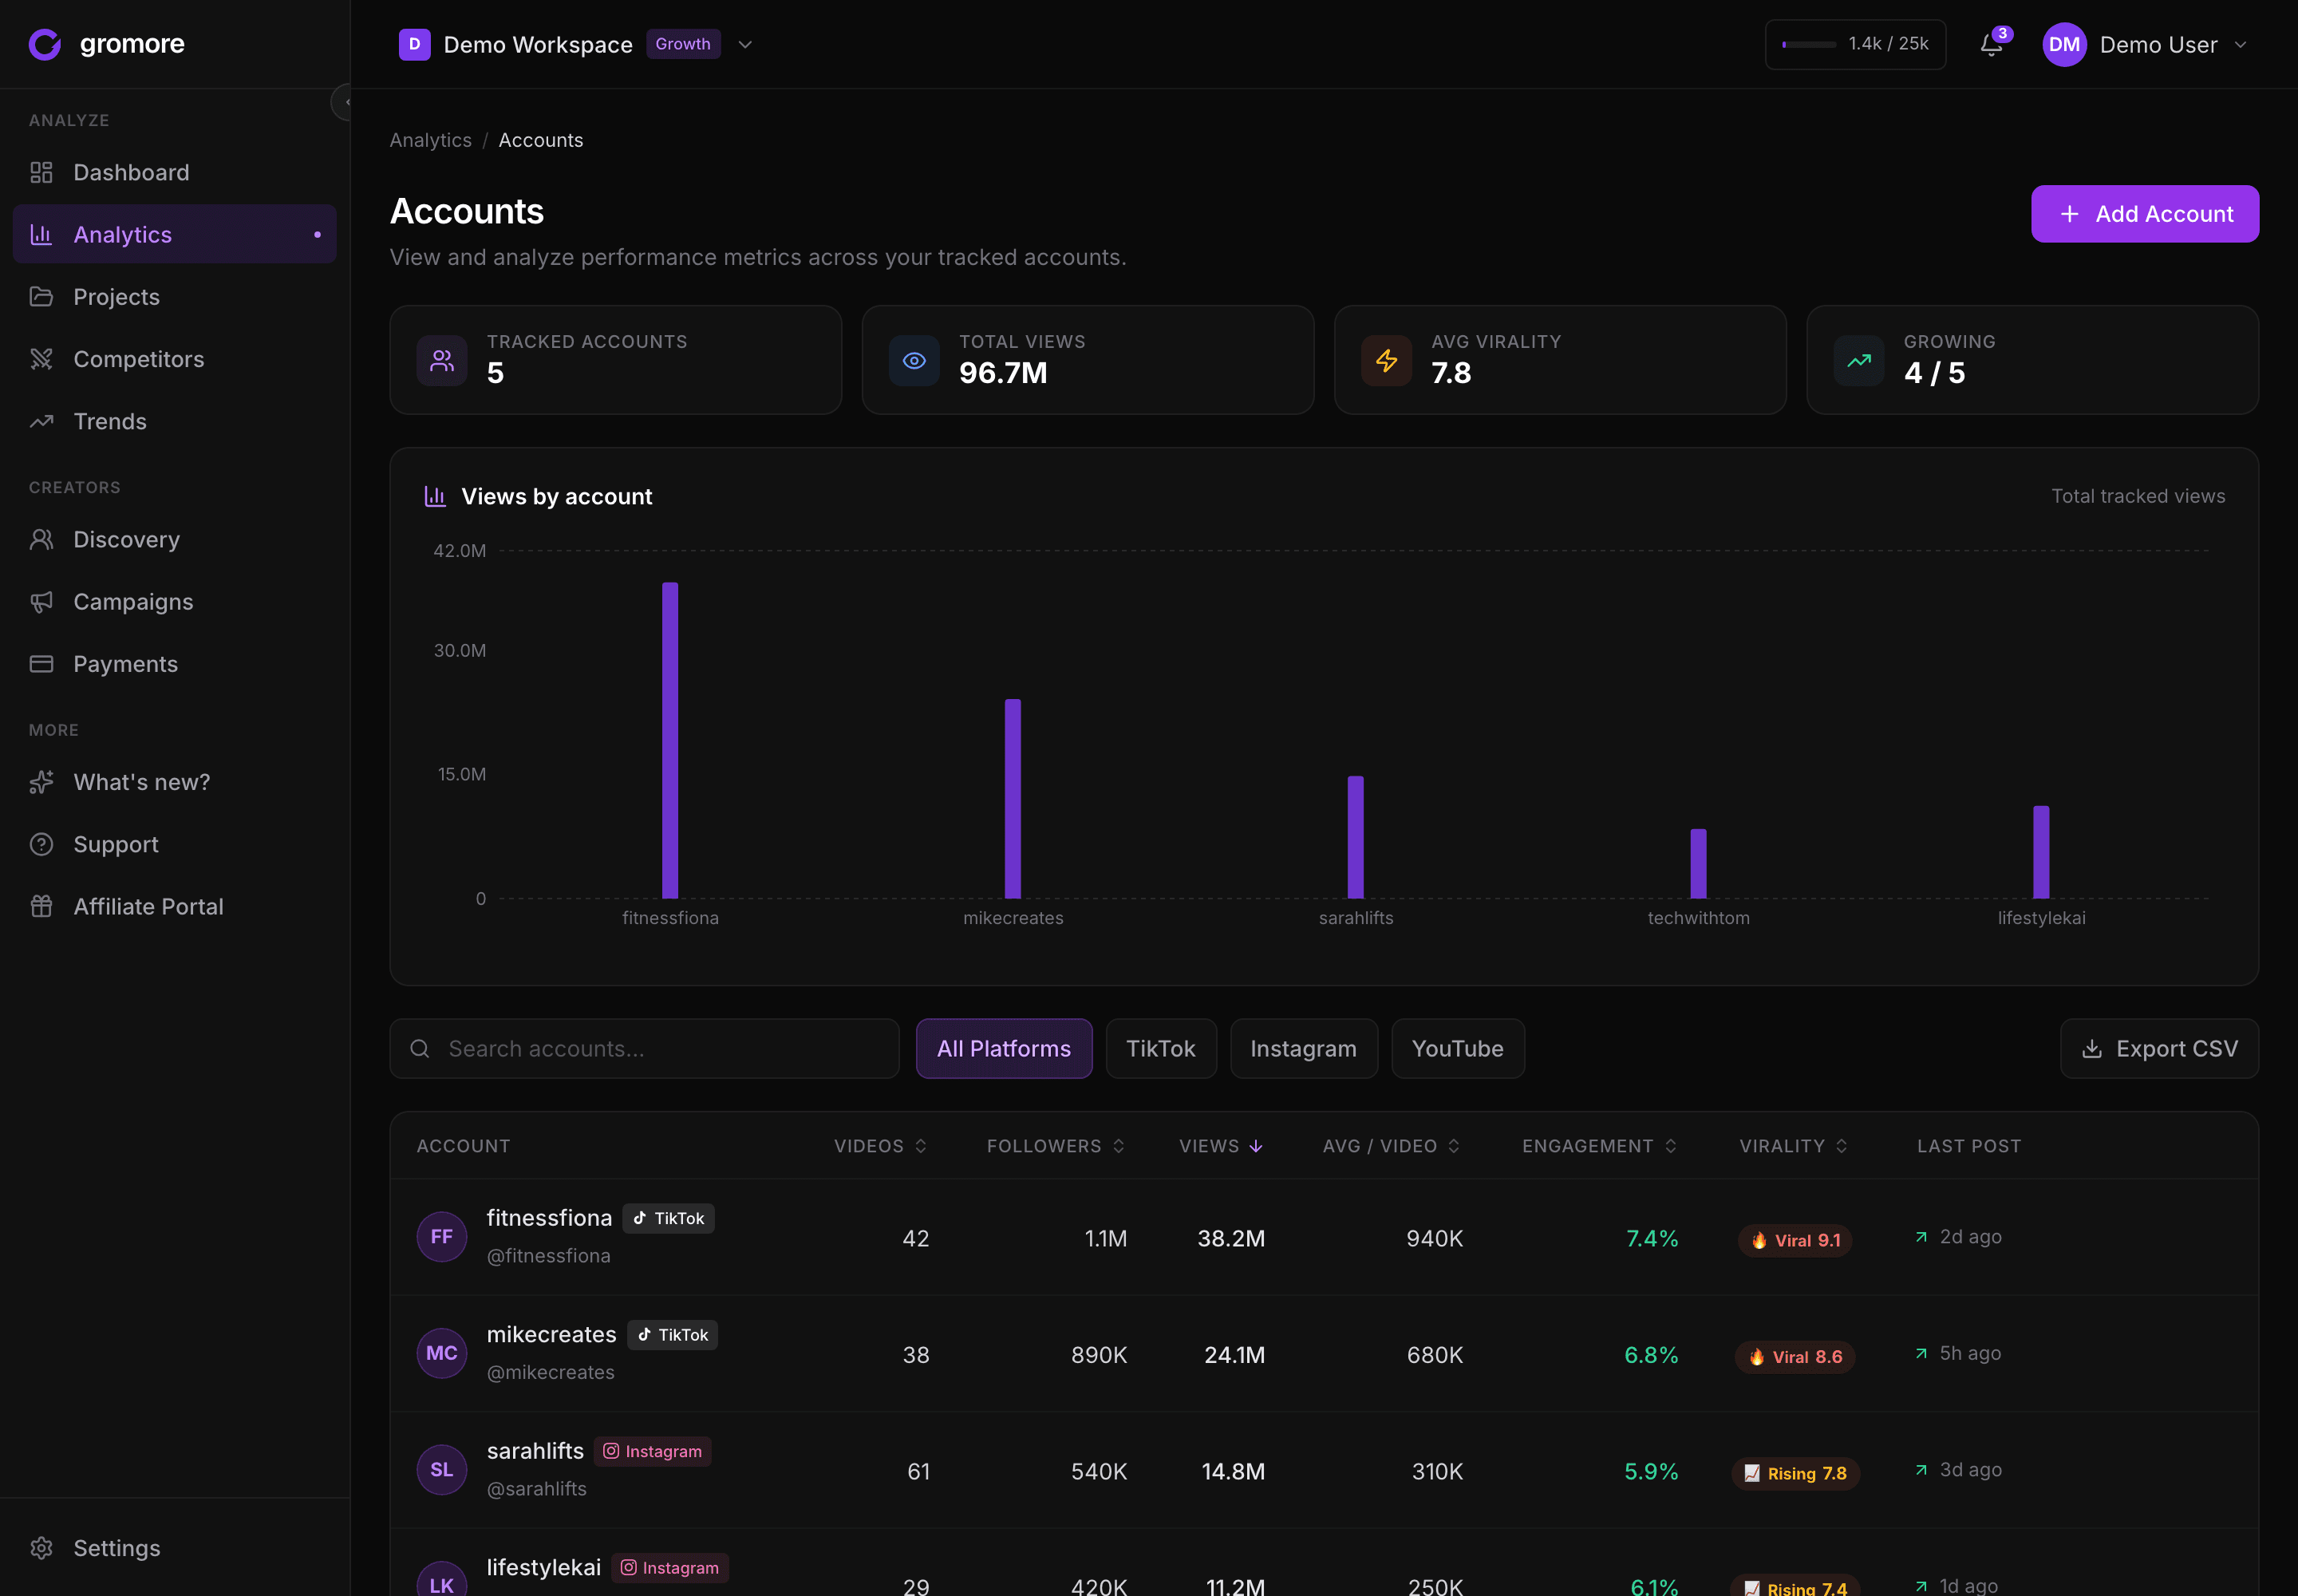
Gromore collapses the two halves it owns — cost and performance — into one place. It tracks each creator's content across TikTok, Instagram, and YouTube (views over time, engagement, watch-through — your leading indicators), and it records what you paid them through a base + CPM + milestone payout engine with approvals and an audit trail. So cost-per-creator and performance-per-creator already sit side by side, per creator and per video, with no manual stitching.
To be clear about the boundary: Gromore doesn't run your checkout pixel or move payout money — it calculates and records payouts, and you bring the attributed-revenue figure from your store or surveys. What it removes is the spreadsheet reconstruction, so the moment you have a revenue number, the cost and performance sides are already assembled next to it. That's the unglamorous 80% of creator ROI tracking software — and it's most of the monthly job. For the wider framework, start with our UGC analytics guide.
Your UGC ROI checklist for this week
You can set most of this up in an afternoon:
- Split your UGC into buckets — organic reposts, whitelisted paid, review/email-sourced — and stop averaging them together.
- Total your real cost — payouts plus gifting COGS, amplification, tooling, and team hours.
- Assign a unique code or link to every active creator so redemptions give you a hard revenue floor.
- Turn on a post-purchase "how did you hear about us?" survey for the assisted middle.
- Pick your lens — MER at the program level, multi-touch for per-touch detail — and stop judging UGC on last-click alone.
- Watch leading indicators weekly, lagging ones monthly — act on views and saves early, confirm with attributed sales later.
- Schedule one holdout test this quarter to size the lift you can't otherwise see.
- Book a keep/cut/scale decision each month — rank creators and formats by cost against performance, and actually move budget.
Bottom line
You can't put a decimal-precise ROAS on UGC, and any tool that promises one is selling false confidence. What you can do is calculate cost honestly, credit revenue in two layers — hard attributed sales plus a real estimate of assisted lift — read leading indicators fast and lagging ones carefully, and pressure-test the whole thing with the occasional holdout. Do that, and "what's our UGC ROI?" stops being a guess and becomes a number you can defend and, more importantly, act on.
The brands that win at this aren't the ones with the cleverest attribution model. They're the ones who keep cost and performance in one place, make a keep/cut/scale decision every month, and don't kill upper-funnel content just because last-click can't see it.
Want per-creator cost and performance sitting in one place instead of five spreadsheets? Start a free 7-day Gromore trial — no card required.