Short answer: UGC analytics is how brands measure whether their user-generated content is actually working — tracking creator and video performance across TikTok, Instagram, and YouTube, tying it to ROI, and using that data to run campaigns, pay creators fairly, and outmaneuver competitors. This guide covers the whole discipline end to end: measurement, tooling, campaign ops, payouts, and competitive intelligence.
User-generated content stopped being a "nice to have" years ago. For most D2C brands, creator content now outperforms polished brand ads — it's cheaper to produce, it converts better, and audiences trust it more. But there's a catch that trips up almost every brand scaling UGC: the moment you're running more than a handful of creators, you can't tell what's actually working.
That's the job of UGC analytics. Not vanity dashboards — the specific discipline of measuring creator performance, connecting it to revenue, and turning that signal into better decisions about who to work with, what to pay them, and where to double down. This guide is the complete map: what UGC analytics is, the five areas it breaks into, and how to actually put it to work — whether you're a D2C brand running your own program or an agency running many.
What UGC analytics actually is
UGC analytics is the measurement layer for a creator content program. It answers questions a normal social dashboard can't:
- Which creators drive views, engagement, and sales — not which posts got likes?
- Is a given campaign actually returning more than it costs?
- Which content formats and hooks repeat as winners?
- What are competitors doing, and what's about to trend?
The distinction that matters: social media analytics measures your owned accounts; UGC analytics measures the creators making content for your brand — often on their accounts, across multiple platforms, tied back to what you paid them and what it earned. That's a different data model, and it's why generic social tools fall short the moment creator payouts and cross-platform attribution enter the picture.
Done well, UGC analytics touches five connected areas. The rest of this guide walks through each, with links to go deeper on the specific playbooks.
The UGC analytics metrics and terms that matter
Before the five areas, it helps to speak the language. These are the terms that actually drive decisions:
- Views — and views-over-time. The base unit of reach. What matters isn't the number on any single day but the curve: how a video accumulates views over its first week and beyond. Newer content lags, then catches up, so judging a video on day one is a classic mistake.
- Engagement rate. Interactions (likes, comments, shares, saves) over views or followers. A directional signal of resonance — but easy to inflate and not the same as intent to buy. Saves are the most underrated of the bunch: a save ("I want to come back to this") is a far stronger buying signal than a like.
- Watch-through / completion. How much of a video people actually finish. Platforms reward high completion with more distribution, so it's a leading indicator of reach before the views even arrive.
- CPM (cost per mille). Cost per 1,000 views — used both to price creator view-bonuses and to compare UGC's efficiency against paid media.
- Attribution. Connecting a creator's content to a real outcome (a sale, a signup). The hardest and most valuable metric, because much of UGC's value is upper-funnel and never click-attributes cleanly.
- Virality / multiplier. How far a video reached relative to that creator's normal baseline. A 10× video from a mid-sized creator often matters more than a big raw number from a big account.
- Follower count. The most visible metric and the least useful for predicting sales. Treat it as context, never as a KPI.
Keep these straight and every decision downstream — who to work with, what to pay, what to make more of — gets easier.
Area 1: Measuring UGC performance and ROI
Everything starts with measurement, because you can't optimize — or defend the budget for — a program you can't quantify. The trap most brands fall into is measuring the wrong things: likes and follower counts feel good but don't tell you whether anyone bought anything.
The metrics that actually matter for UGC are performance-over-time signals — views, watch-through, saves, and ultimately attributed conversions — not a single day's snapshot. A video that looks flat this week may have driven a strong month a quarter ago. Getting this right means separating vanity metrics from the ones that predict revenue, and it means measuring creators (who consistently performs) rather than just individual posts (which are noisy).
From there, the harder question is ROI: does UGC return more than it costs? That requires tying creator spend to outcomes — and having an honest framework for what "return" means when a lot of UGC value is upper-funnel. It's also where the UGC-vs-paid-ads debate gets settled with data rather than vibes.
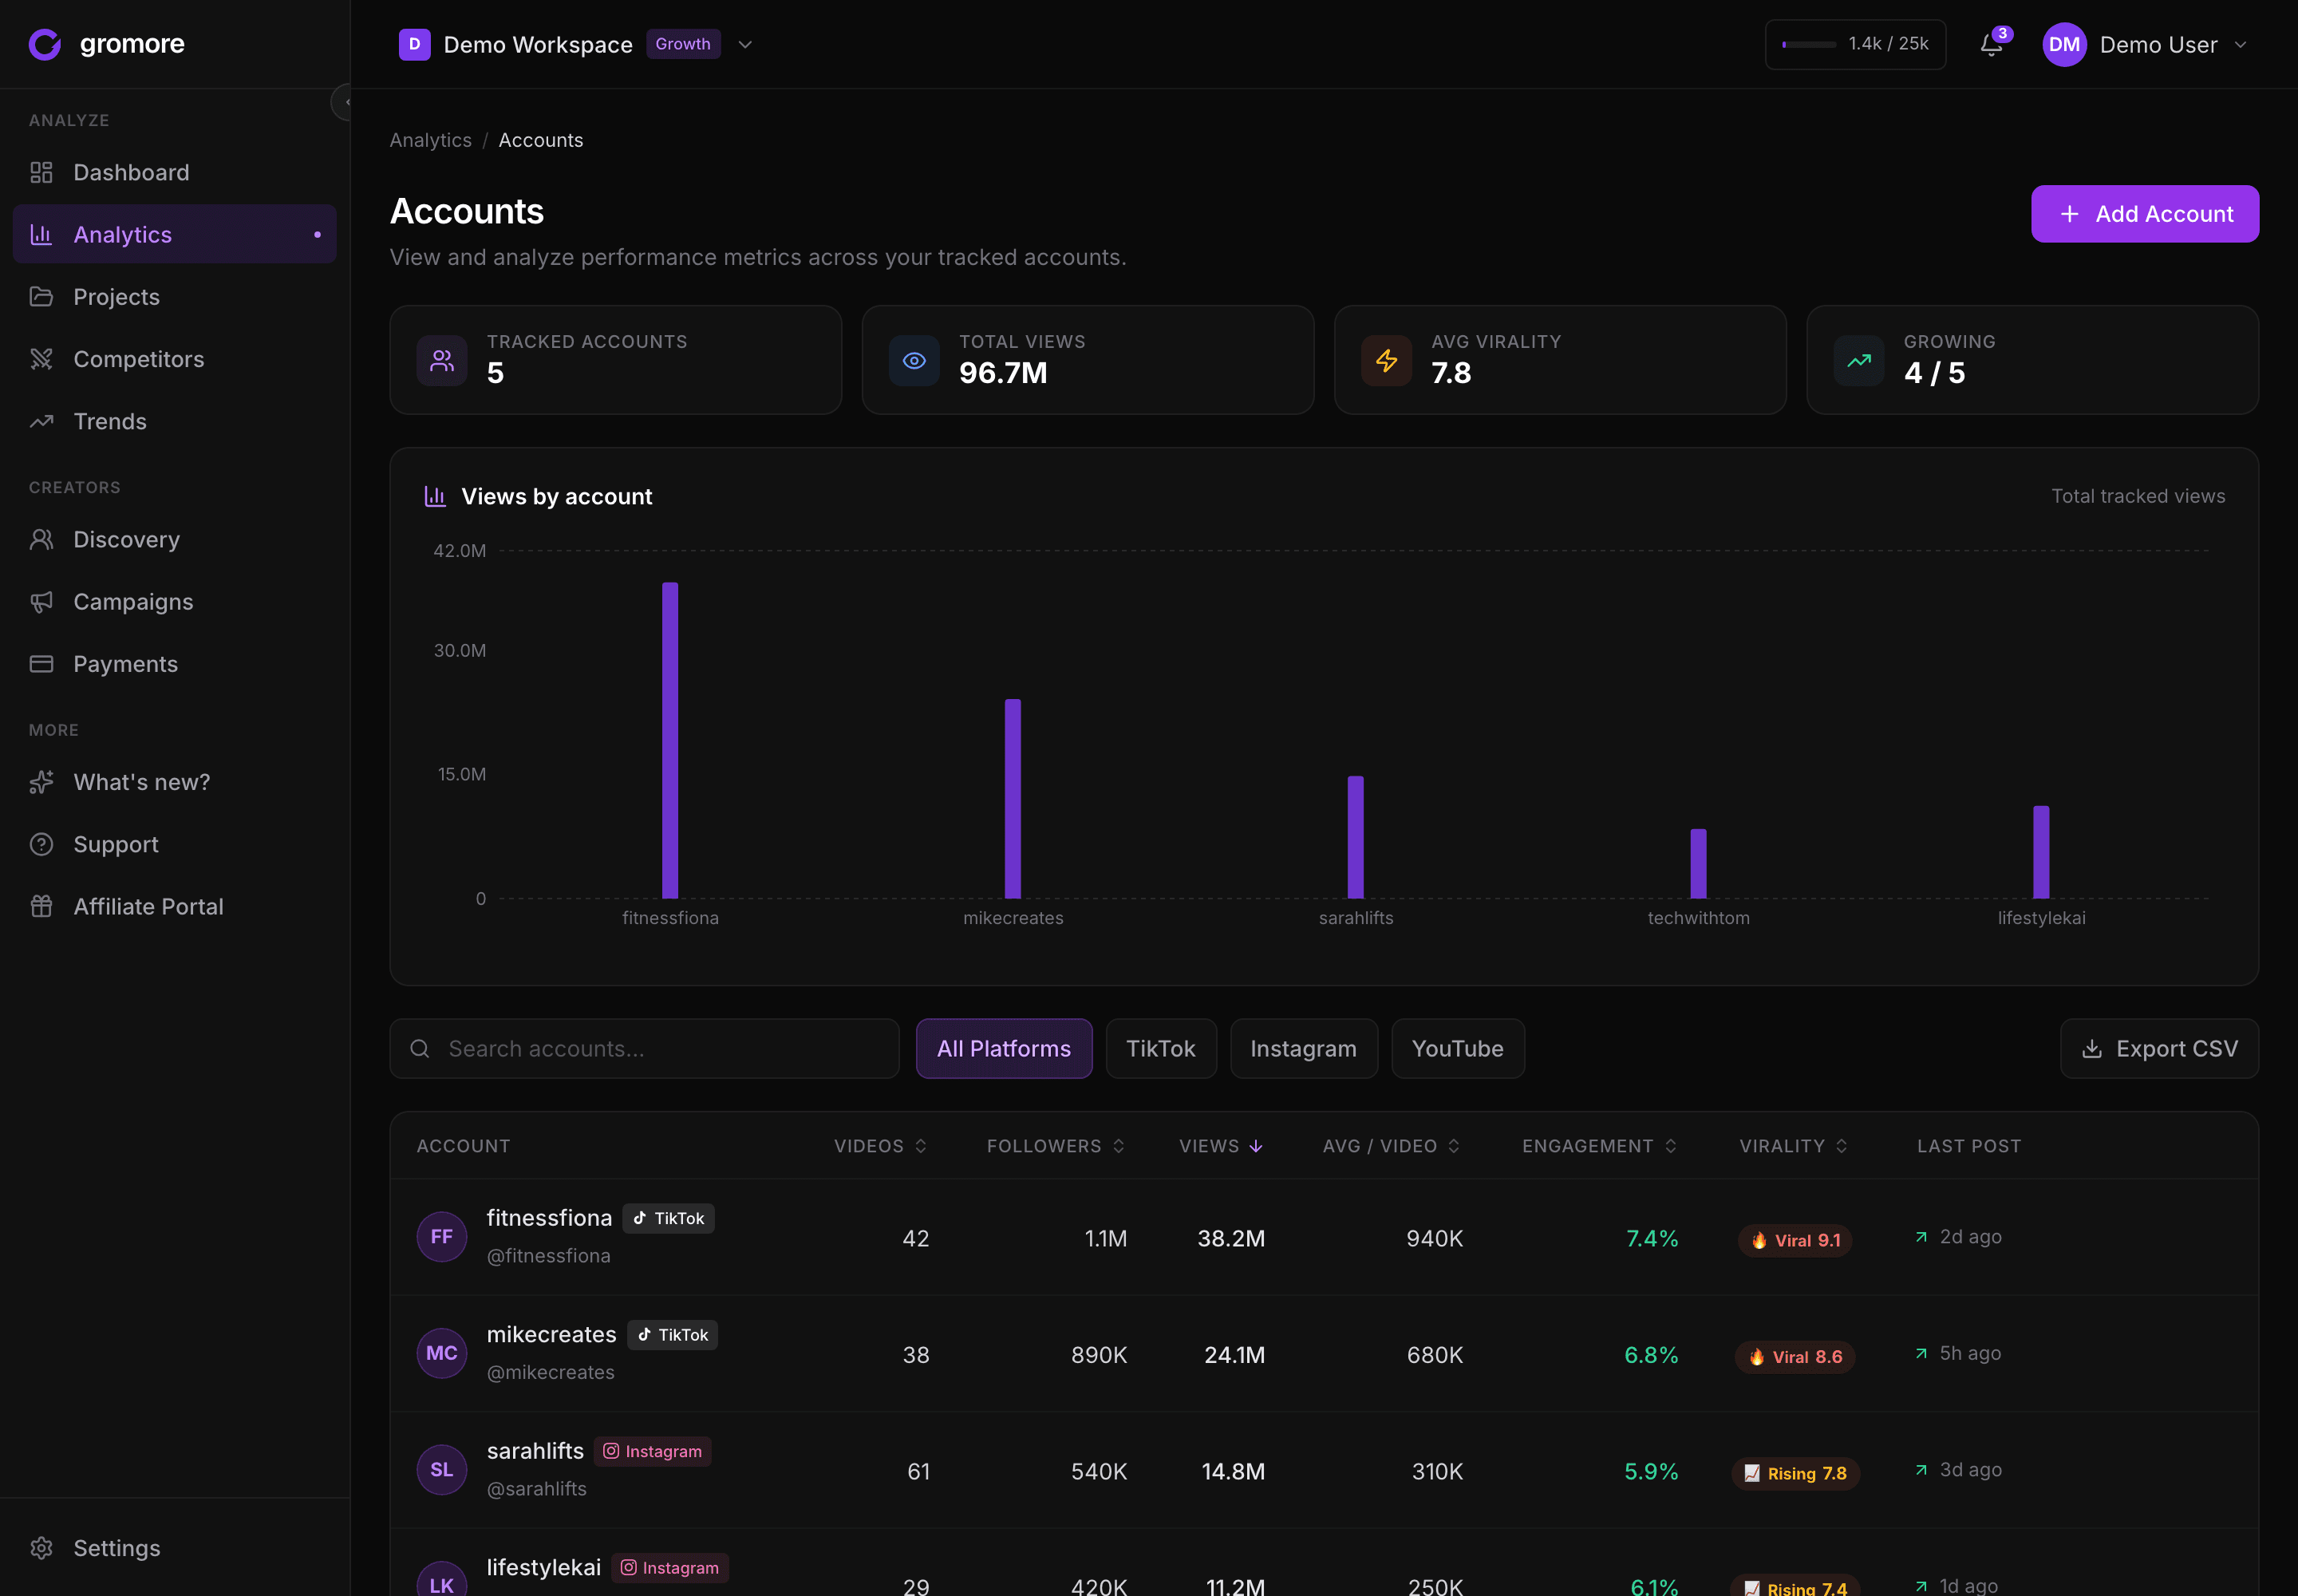
What good measurement looks like in practice is boring and consistent: one view where every creator's videos are tracked across every platform they post on, updated over time, with the two or three metrics that map to your revenue pinned to the top — not a dashboard you check when you remember, but a standing scoreboard you trust enough to make roster and budget calls from. A useful discipline is to separate leading indicators (watch-through, saves, early view velocity) from lagging ones (attributed sales), and to judge creators on a rolling window rather than a single campaign. The brands that win at UGC aren't the ones with the fanciest analytics — they're the ones acting on a simple, reliable signal every week while competitors are still exporting spreadsheets.
Go deeper on measurement and ROI: - The UGC metrics D2C brands should actually track - UGC vs influencer ads: what the 2026 data says - How to measure UGC ROI - Creator ROI tracking software, compared
Area 2: Choosing your UGC analytics tools
Once you know what to measure, you need something to measure it with — and the spreadsheet stops scaling fast. The tooling market is crowded and confusing because "UGC" gets used for everything from on-site review widgets to enterprise influencer CRMs, which are completely different products for completely different buyers.
For a D2C brand or agency, the tool that matters is one that tracks creator and video performance across TikTok, Instagram, and YouTube in one place — ideally with campaign management and payouts attached, so you're not stitching three tools together. The big decisions are: breadth vs depth (a generalist social suite vs a creator-native tool), price model (self-serve monthly vs enterprise annual contracts), and whether payouts and competitor intelligence are built in or bolted on.
The honest way to choose is to write down the three jobs you actually need done, then judge each tool on those — not on a 200-item feature list you'll never touch. That's especially true if you're evaluating an enterprise incumbent whose price assumes a dedicated in-house team you may not have.
The single biggest decision is one platform vs a stitched-together stack. You can assemble a dashboard, a campaign tracker, a payout spreadsheet, and a reporting deck — and many brands do — but every seam between those tools is where data gets re-keyed, numbers drift, and hours vanish. A consolidated tool that covers analytics, campaigns, and payouts together is usually cheaper in total than three "affordable" point tools once you count the labor of gluing them. When you evaluate, run a real workflow through a free trial before committing: track one creator, set one payout rule, pull one report. If any of those three takes more than a few minutes, that friction compounds every week you own the tool.
Go deeper on tools and alternatives: - The best UGC tracking tools for Shopify brands - viral.app vs Gromore, compared - The best GRIN alternative for growing brands - A CreatorIQ alternative for D2C brands and small agencies
Area 3: Running creator campaigns (brief → track → payout)
Analytics without workflow is just a report you read after the fact. The real payoff comes when measurement is wired into how you run campaigns — the loop of brief → track → approve → payout.
The failure mode is familiar: briefs live in a Doc nobody re-reads, conversations scatter across DMs and email, approvals happen in screenshots, and payouts become a month-end reconciliation nightmare. Somewhere around 15–20 creators, the spreadsheet-and-DMs stack collapses and you spend more time administering the program than growing it. Creator campaign management software exists to make each stage of that loop a step in one system instead of four disconnected chores.
Concretely, the loop has four stages and each has its own failure point. Brief: direction lives in a Doc nobody re-reads, so creators improvise. Track: content posts across three platforms that each count views differently, so you reconcile by hand. Approve: feedback happens over DMs with no record of what was signed off. Payout: you rebuild everyone's performance bonus from raw view counts in a sheet that's one fat-fingered cell from paying someone triple. Good campaign software makes each stage a step in one system with a shared record — so the brief, the approval, the performance, and the payout for a given creator all live in one place, not four.
For agencies, the same loop has to run across many client brands at once — which raises a whole extra layer of requirements around data isolation, roles, and per-client reporting. Get the workflow right and you scale from five creators to fifty without adding headcount; get it wrong and every new creator adds an hour of admin.
Go deeper on campaign management: - Creator campaign management software: what to actually look for - From brief to payout: how to run a UGC creator campaign - Creator content approval workflows - Managing multiple brands as a UGC agency
Area 4: Paying creators
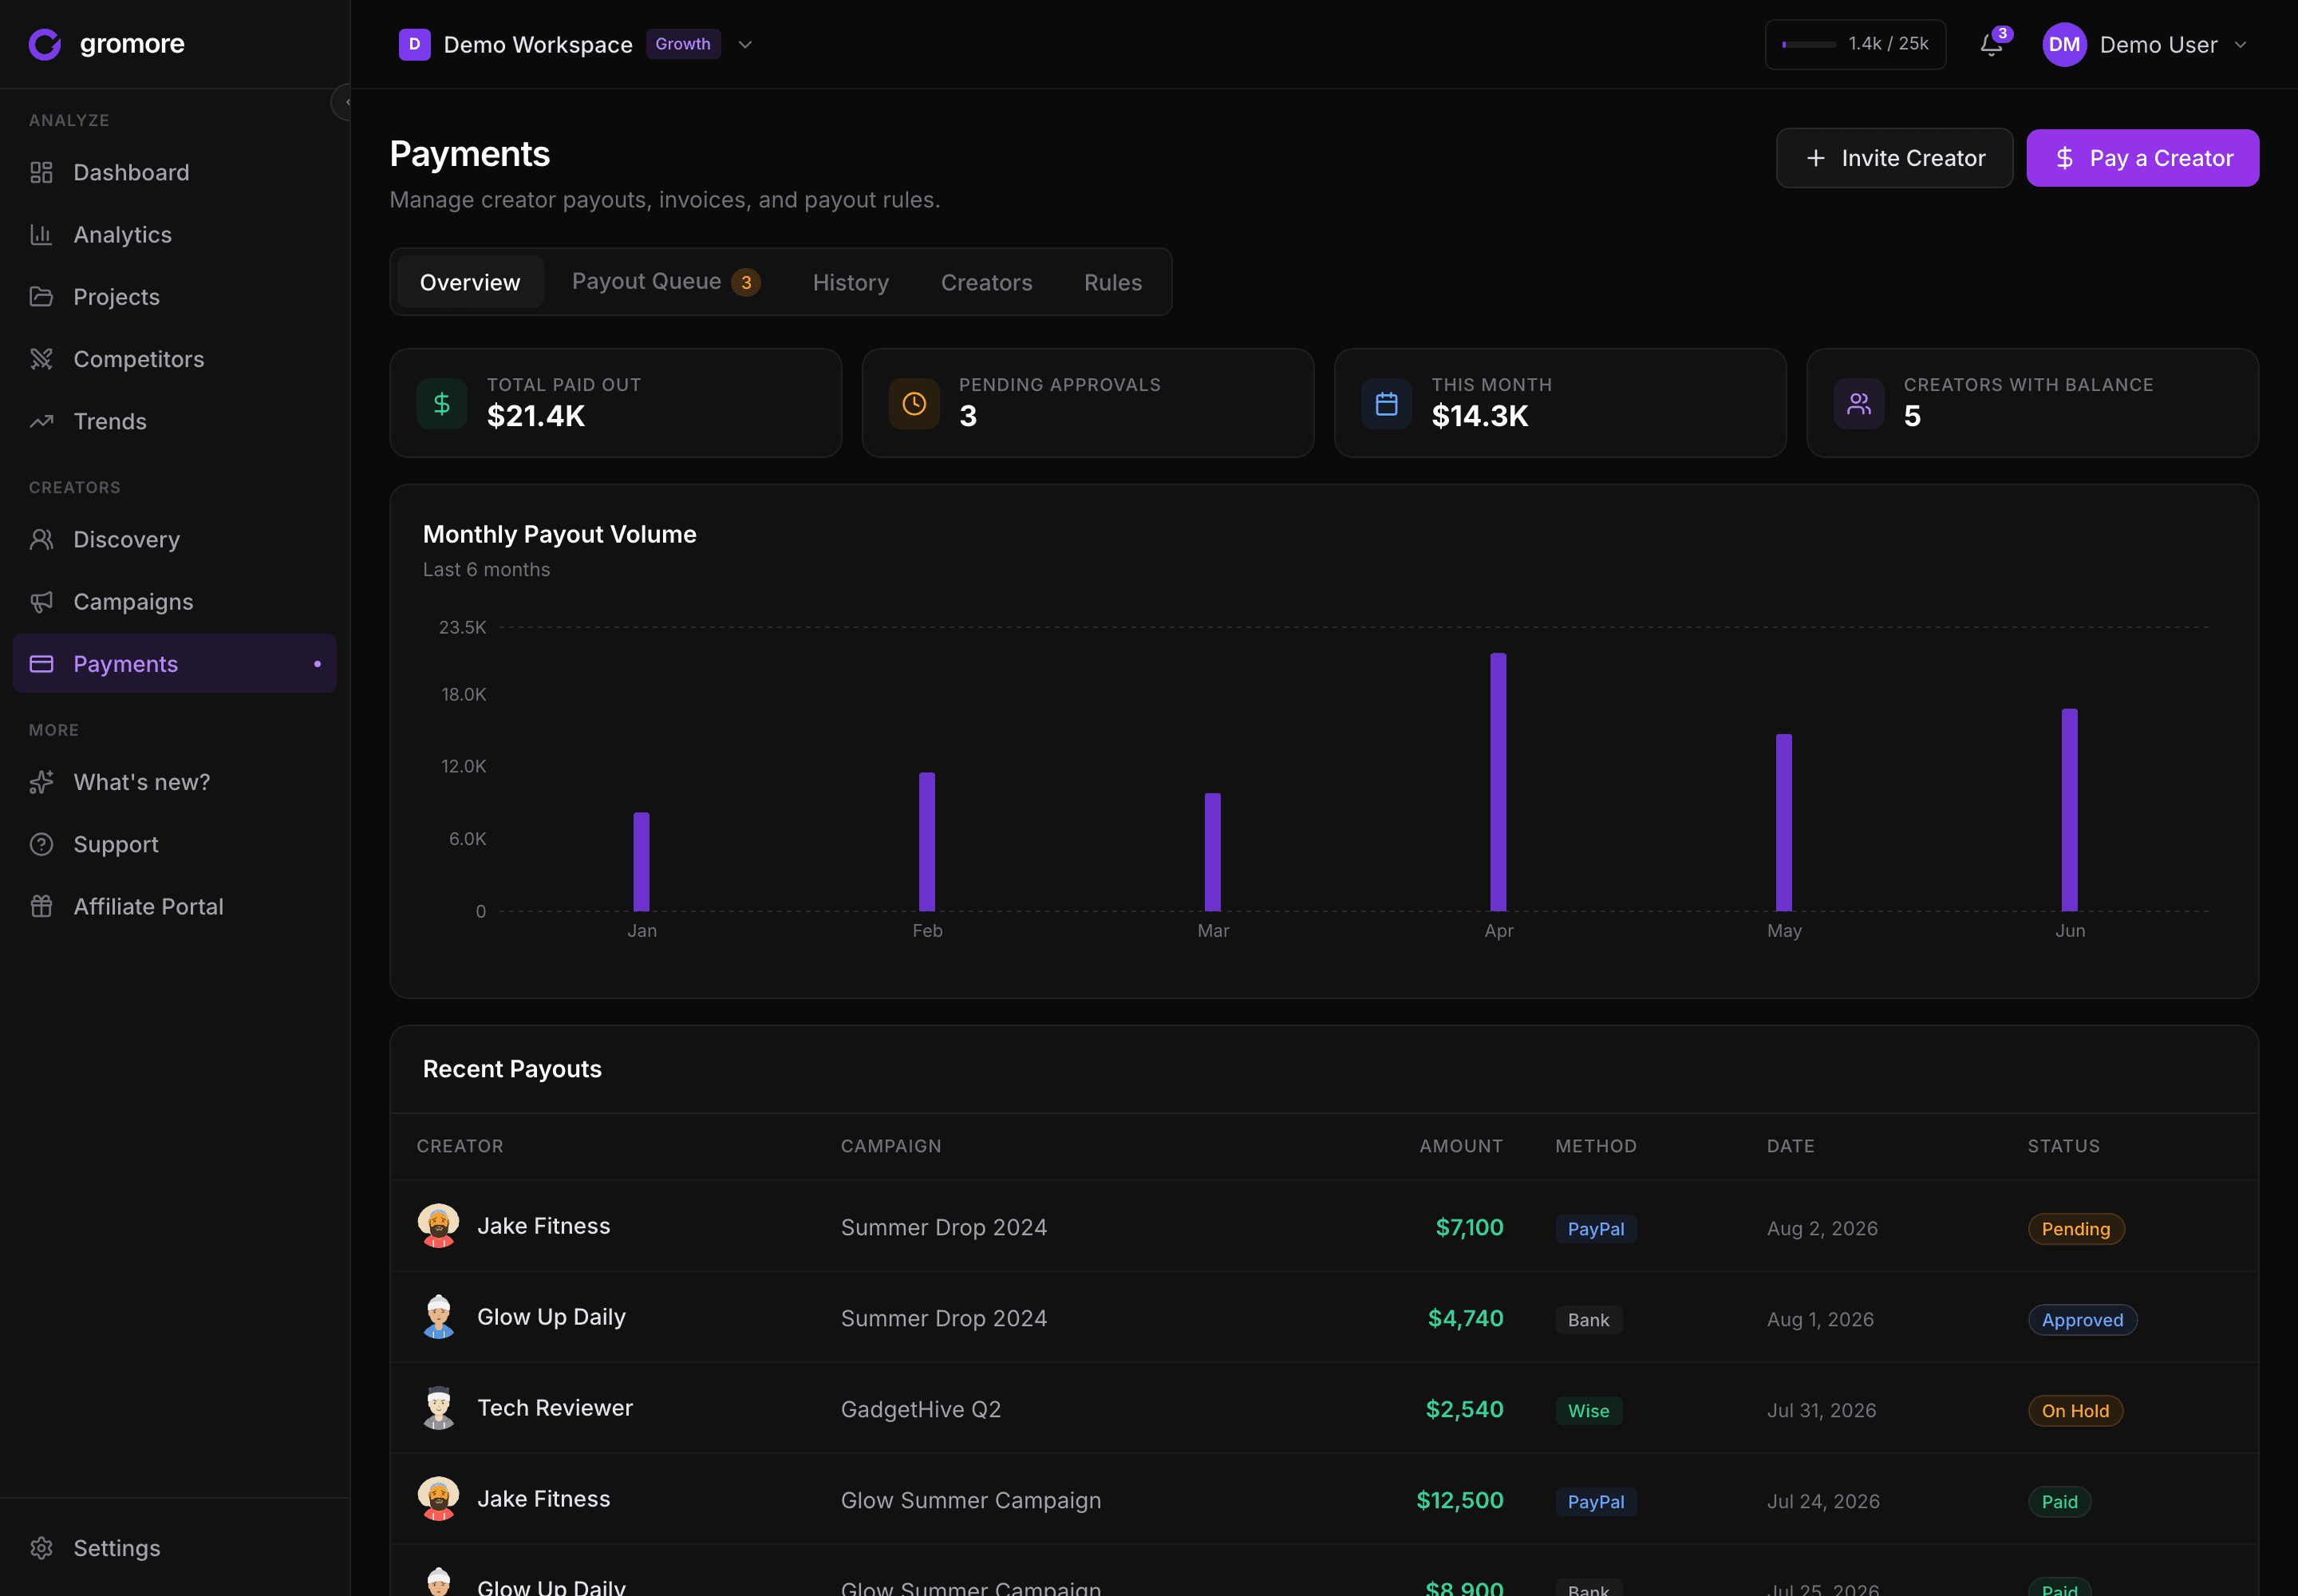
Payouts are where UGC programs quietly succeed or fall apart. Pay a flat fee and creators have no reason to push; pay pure commission and their income swings wildly and your best ones leave. The modern answer combines three building blocks — base pay (a guaranteed floor), CPM bonuses (paid per 1,000 views), and milestone bonuses (paid when a specific result hits) — weighted toward base when your program is new and toward performance as you scale.
Getting the structure right is half the battle; calculating it fairly at scale is the other half. Recomputing every creator's base-plus-CPM-plus-milestone from raw view counts in a spreadsheet is exactly the kind of manual, error-prone work that a payout rules engine should handle — deriving each payout automatically from tracked performance, with an approval step and an audit trail. (Worth being precise here: good software calculates and records payouts; the actual money movement stays under your control.)
A quick illustration of the three blocks working together: a creator posts four videos in a month at a $150 base each ($600), earns a $3-per-1,000-views bonus on the 230,000 views they generated ($690), and hits a milestone for crossing 100K on one video ($150) — about $1,440 for the month, with the base guaranteeing they got paid to show up even if the views hadn't landed. Run the same creator through a quiet month and that base still floors their income, which is exactly why good creators stay through slow weeks instead of chasing the next brand. The mechanics are simple; doing this fairly, for fifty creators, every cycle, from tracked data rather than a spreadsheet is what separates a program that scales from one that quietly overpays and underpays by turns.
The remaining questions — how much to pay in the first place, and which payment methods and automation to use — are their own playbooks.
Go deeper on payouts: - UGC creator payouts: how much to pay and how to structure rates - How to pay UGC creators - Creator payout structures: base pay vs CPM vs milestone bonuses - The best influencer and creator payment automation software
Area 5: Competitor and cross-platform intelligence
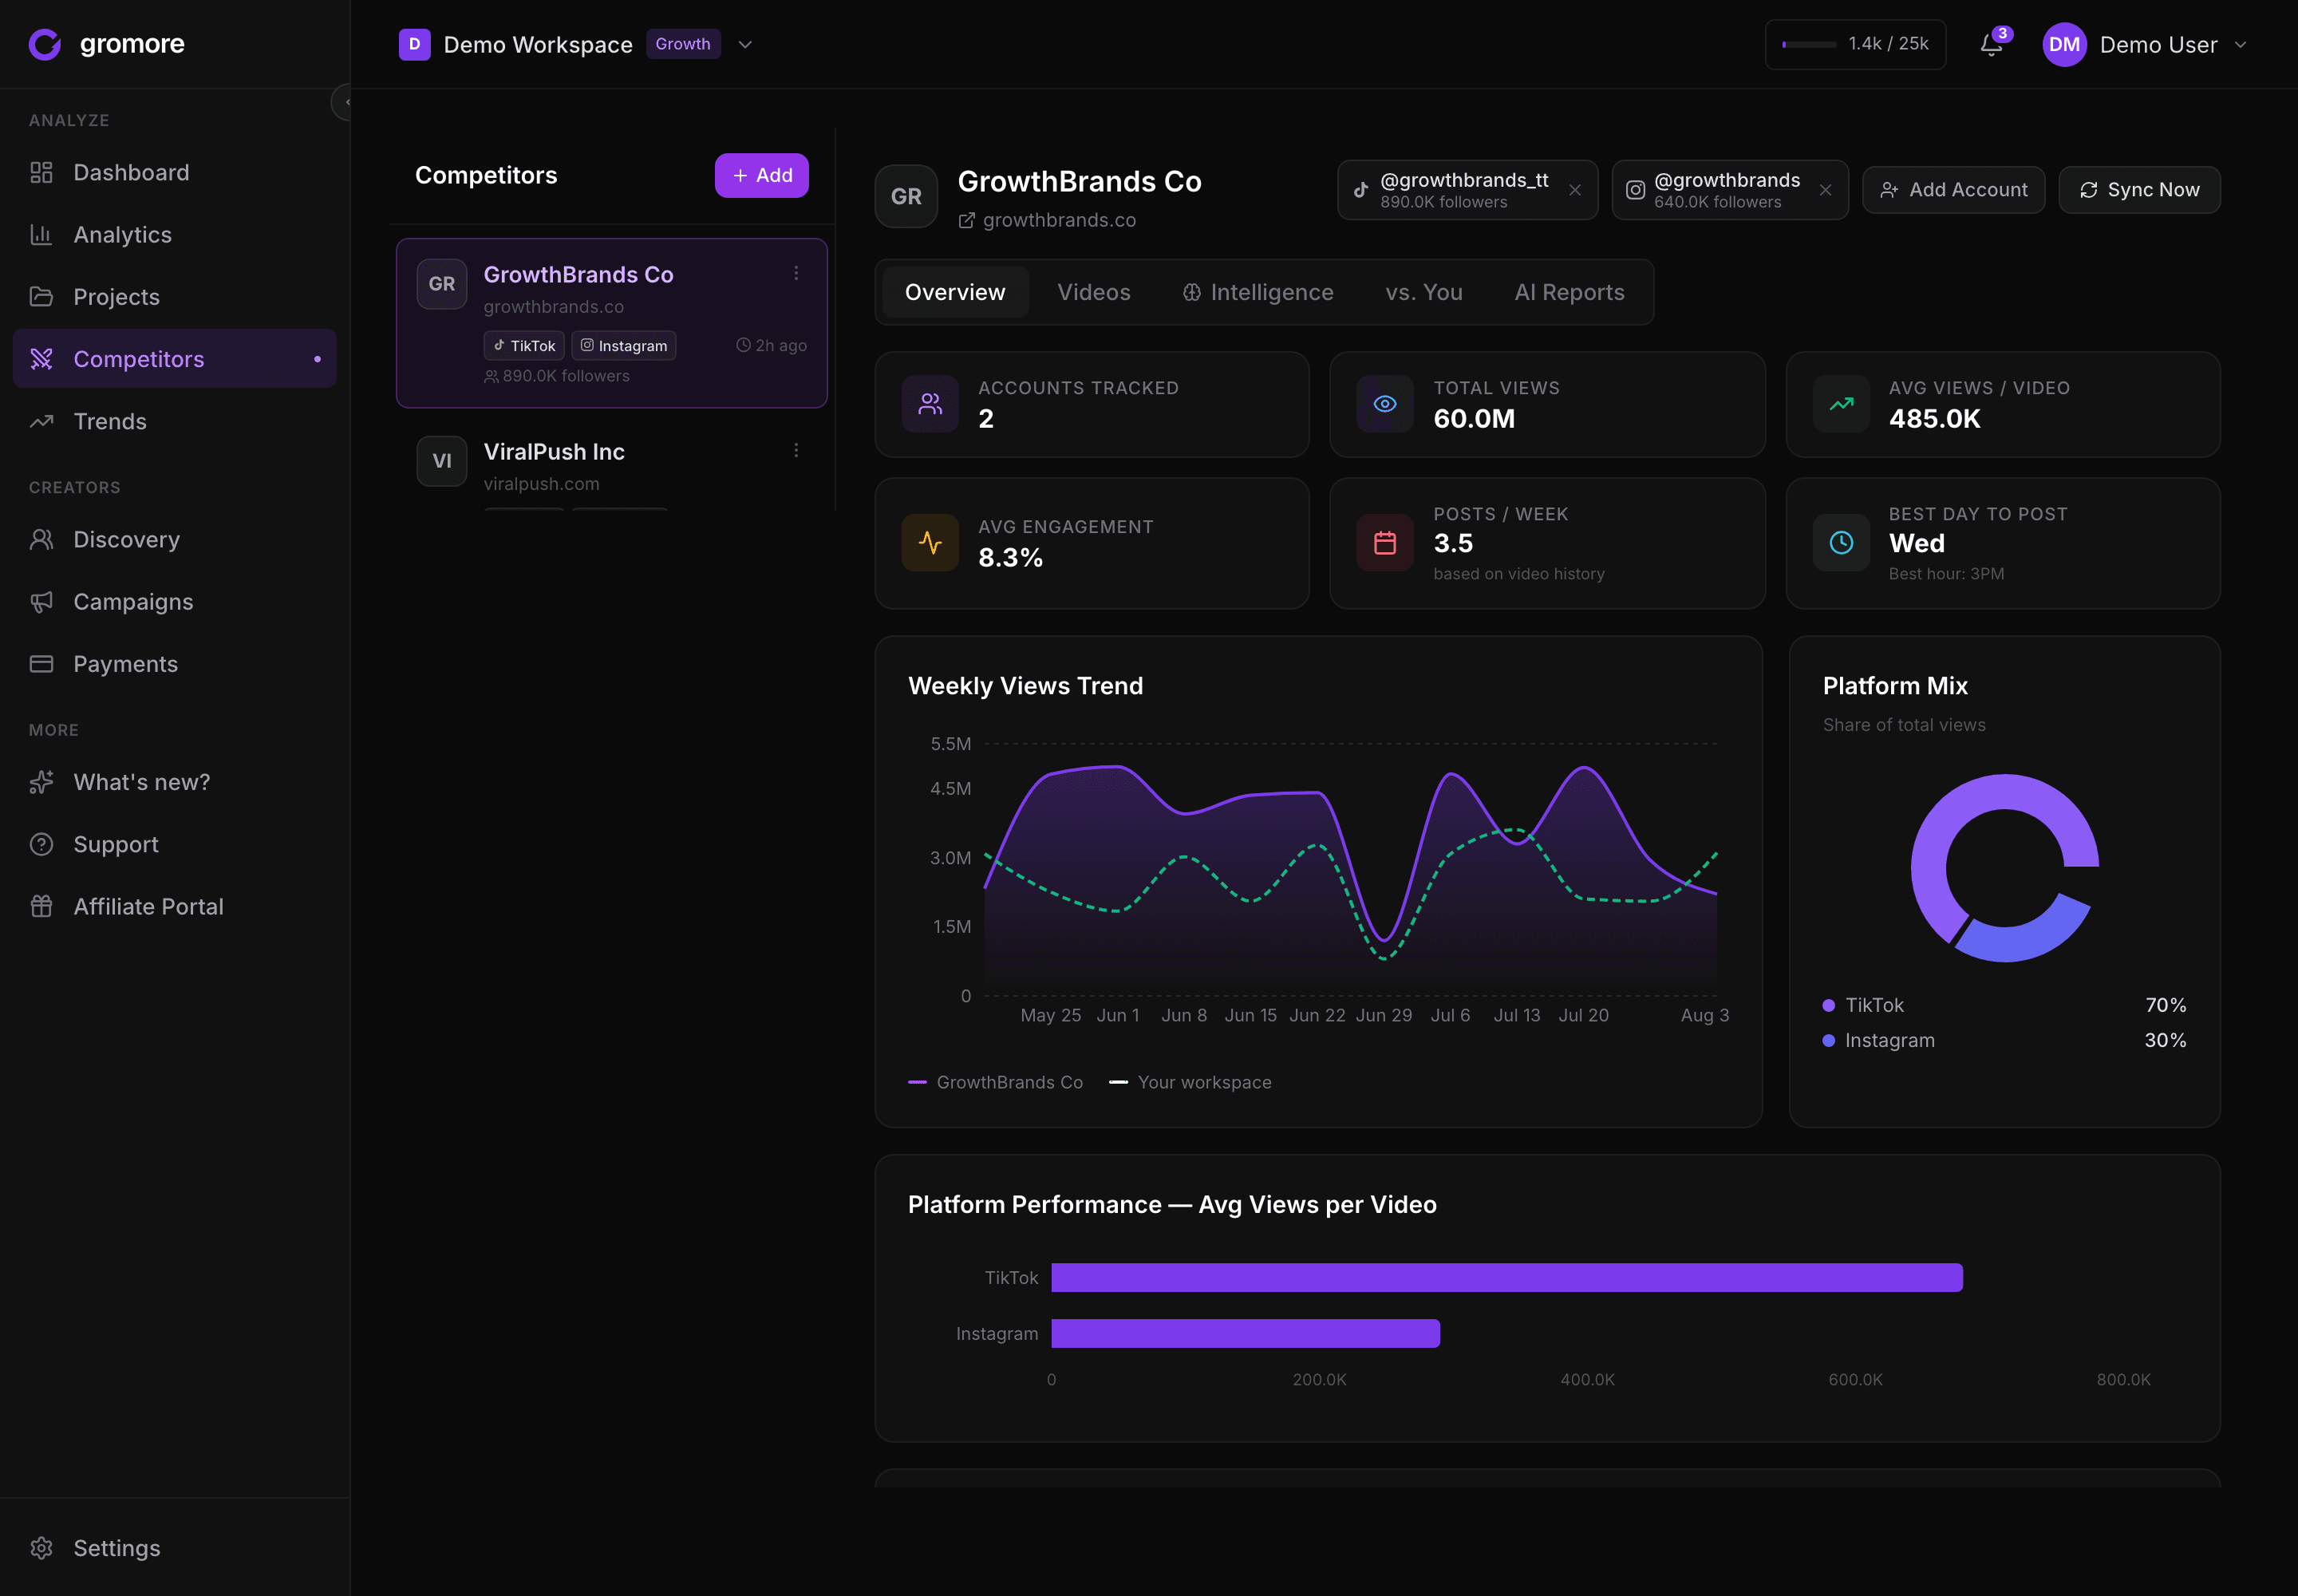
The most underused part of UGC analytics is looking outward. Your competitors have already spent money finding creators who convert in your exact market — and much of that is visible if you know where to look. Competitor creator intelligence turns a rival's roster into a ready-made shortlist of pre-proven partners, and their content into a map of the hooks and formats already working in your category.
The cross-platform piece matters just as much. A creator can be a workhorse on TikTok and an afterthought on Instagram; a format can pop on one platform and flop on another. Real UGC analytics tracks performance per platform — TikTok, Instagram, and YouTube each measured on their own terms — and surfaces trends early enough to act on them before they're obvious to everyone.
Here's the compounding version most brands miss: a creator you discover through Competitor A's roster might be a perfect fit for a different product line — or, if you're an agency, a different client entirely — in an adjacent niche. A single-brand view can't see that overlap; a portfolio view turns one piece of competitor intel into opportunities across everything you run. On the cross-platform side, the practical rule is to never trust a blended number: pull TikTok, Instagram, and YouTube apart, because a creator who's your best performer on one is often mid-pack on another, and booking them for the wrong platform quietly wastes budget.
Together, competitor and cross-platform intelligence are what separate a brand that reacts from one that anticipates.
Go deeper on competitive and cross-platform intelligence: - Competitor creator intelligence: see which creators your rivals run - TikTok creator analytics for brands - Instagram UGC tracking - TikTok trend discovery for brands
How to get started: a practical roadmap
You don't need all five areas humming on day one. Here's a sane order of operations:
- Week 1 — Instrument what you already run. Get your current creators and their content into one place, tracking views and engagement across every platform they post on. You can't improve what you can't see.
- Week 2 — Define your metrics and a baseline. Pick the handful of metrics that map to revenue for your brand, and record where each creator stands today. Ignore likes-and-followers; anchor on performance-over-time and, where you can, attributed conversions.
- Week 3 — Wire measurement into a campaign. Run one campaign end to end in a real workflow: brief, track, approve, and set a payout rule (base + CPM + any milestone) so payouts calculate themselves.
- Week 4 — Look outward. Add two or three competitors and start building your next creator shortlist from their rosters instead of cold-searching hashtags.
After that first month you'll have a working loop — and the data to decide where to invest next, whether that's deeper measurement, more creators, or agency-scale multi-brand operations.
Common UGC analytics mistakes to avoid
- Measuring posts, not creators. Individual posts are noisy; a creator's track record over time is the signal. Optimize the roster, not the feed.
- Chasing vanity metrics. Likes and followers feel like progress. Views-over-time, saves, and attributed sales are progress.
- Paying flat fees. A flat rate gives creators no reason to perform and gives you no upside when they do. Structure pay.
- Treating platforms as interchangeable. A blended cross-platform number hides which platform actually earns. Measure each on its own terms.
- Ignoring competitors. The fastest creator shortlist in your niche is already running for the brand across the street.
- Letting the spreadsheet run the program. It works until ~15–20 creators, then it silently becomes your biggest bottleneck and your biggest source of payout errors.
How Gromore brings it together
Most of the pain in UGC analytics comes from stitching five separate tools — a dashboard, a campaign tracker, a payout spreadsheet, a competitor spreadsheet, and a reporting deck — into something that almost works. Gromore was built to be the one place all five areas live.
It tracks creator and account performance across TikTok, Instagram, and YouTube; runs the full brief → track → payout campaign loop; calculates payouts from a base + CPM + milestone rules engine (record-mode — it does the math and keeps the record, you keep control of the money); surfaces competitor creator intelligence natively; and flags trending content early. For agencies, the Agency plan runs up to 10 isolated client workspaces under one login with 20 team seats, so the whole discipline scales across a book of clients without mixing their data.
Plans run $69–$349/mo with a 7-day free trial and no card required — a self-serve price for a category that's usually sold on enterprise annual contracts.
UGC analytics FAQ
What's the difference between UGC analytics and social media analytics? Social analytics measures your own accounts' posts. UGC analytics measures the creators making content for your brand — often on their accounts, across multiple platforms — and ties it back to what you paid and what it earned. Different data model, different questions.
What metrics should I track for UGC? Start with views-over-time, watch-through, and saves, plus attributed conversions wherever you can measure them. Deprioritize likes and follower counts — they feel like progress but rarely predict revenue.
How do I measure UGC ROI? Tie creator spend to outcomes over a sensible window, and stay honest that much of UGC's value is upper-funnel and won't click-attribute cleanly. The full method is here.
Do I need a tool, or is a spreadsheet enough? A spreadsheet is fine up to roughly 15–20 creators. Past that, tracking across platforms and calculating performance-based payouts by hand becomes the bottleneck — and a common source of payment errors.
How much should I pay UGC creators? It depends on creator size and platform, but most modern programs combine a base fee, a CPM view-bonus, and occasional milestone bonuses rather than a flat rate. See payout structures and benchmarks.
Can I really see which creators my competitors use? Largely, yes — much of a competitor's active roster is visible, which turns it into a shortlist of pre-proven partners. More on competitor creator intelligence.
Bottom line
UGC analytics isn't one tool or one metric — it's a discipline with five connected parts: measure performance and ROI, choose the right tooling, run campaigns in a real workflow, pay creators with a structure that motivates, and look outward at competitors and platform trends. Nail all five and UGC stops being a guessing game and becomes your most efficient growth channel. Use the deep-dive links throughout this guide to go as far as you need on each — and if you'd rather have all five in one platform, that's exactly what Gromore is for.
Ready to put this into practice? Start a free 7-day Gromore trial — no card required — and get your creators, campaigns, and payouts into one place this week.